
Exam objective (Model the data, 25–30 %): Use the CALCULATE function. Related: Create single aggregation measures and Identify use cases for calculated columns (u10), Implement time intelligence measures (u12), Create calculation groups (u13).
1. The pain: a measure that looks like SQL and lies
Aldervane's Head of Consulting wants one matrix: hours by client, billable hours, the client's share of all hours, and hours on UK clients. Tomasz, a senior developer who has written T-SQL for ten years, writes the measures the way he would write a WHERE:
Billable Hours = CALCULATE ( [Hours], Timesheet[Billable] = "Y" )
UK Hours       = CALCULATE ( [Hours], Client[Country] = "UK" )
On his first page every number looks right. Then a colleague drags Billable onto the rows and Country onto the columns, and the matrix starts showing 28 billable hours on the non-billable row and 26 UK hours in the Ireland column. Nothing is broken. Tomasz read CALCULATE as "add a condition". It actually means "evaluate this expression in a modified filter context", and the modification usually replaces filters rather than adding to them.
This unit is about that one difference. Once you can say what the filter context of a cell is, every CALCULATE question on the exam becomes arithmetic.
2. The model we compute in our heads
Description
Two boxes joined by an arrow from left to right. The left box is the dimension table Client with the columns ClientName, which is the key, and Country. The right box is the fact table Timesheet with the columns ClientName, Billable with values Y or N, and Hours. The arrow is labelled one to many, single direction: a filter on Client flows to Timesheet, never the other way. All examples in this unit use this model.
Client
| ClientName | Country |
|---|---|
| Contoso Energy | UK |
| Fabrikam Logistics | Ireland |
| Woodgrove Bank | UK |
Timesheet
| ClientName | Billable | Hours |
|---|---|---|
| Contoso Energy | Y | 10 |
| Contoso Energy | N | 2 |
| Fabrikam Logistics | Y | 6 |
| Fabrikam Logistics | Y | 4 |
| Woodgrove Bank | Y | 8 |
| Woodgrove Bank | N | 6 |
The base measure is Hours = SUM ( Timesheet[Hours] ). Totals to keep in mind: Contoso 12, Fabrikam 10, Woodgrove 14, all clients 36; billable hours 28; UK clients 26.
3. Filter context in one sentence (from u10)
Every cell of a visual is evaluated separately. Its filter context is the set of filters from the row header, the column header, slicers, the filter pane and RLS. In a matrix with ClientName on rows, the Contoso cell has the filter Client[ClientName] = "Contoso Energy", and that filter flows through the relationship to Timesheet. [Hours] there is 12. The total row has no filter on ClientName, so it shows 36.
Habit for the exam: before you compute anything, write down the cell's filter context. Then apply what CALCULATE does to it.
4. CALCULATE sets filters, and it replaces them
CALCULATE ( <expression>, <filter1>, <filter2>, … )
A filter argument like Timesheet[Billable] = "Y" is shorthand for a table with one column and the allowed values:
-- what the engine actually uses
FILTER ( ALL ( Timesheet[Billable] ), Timesheet[Billable] = "Y" )
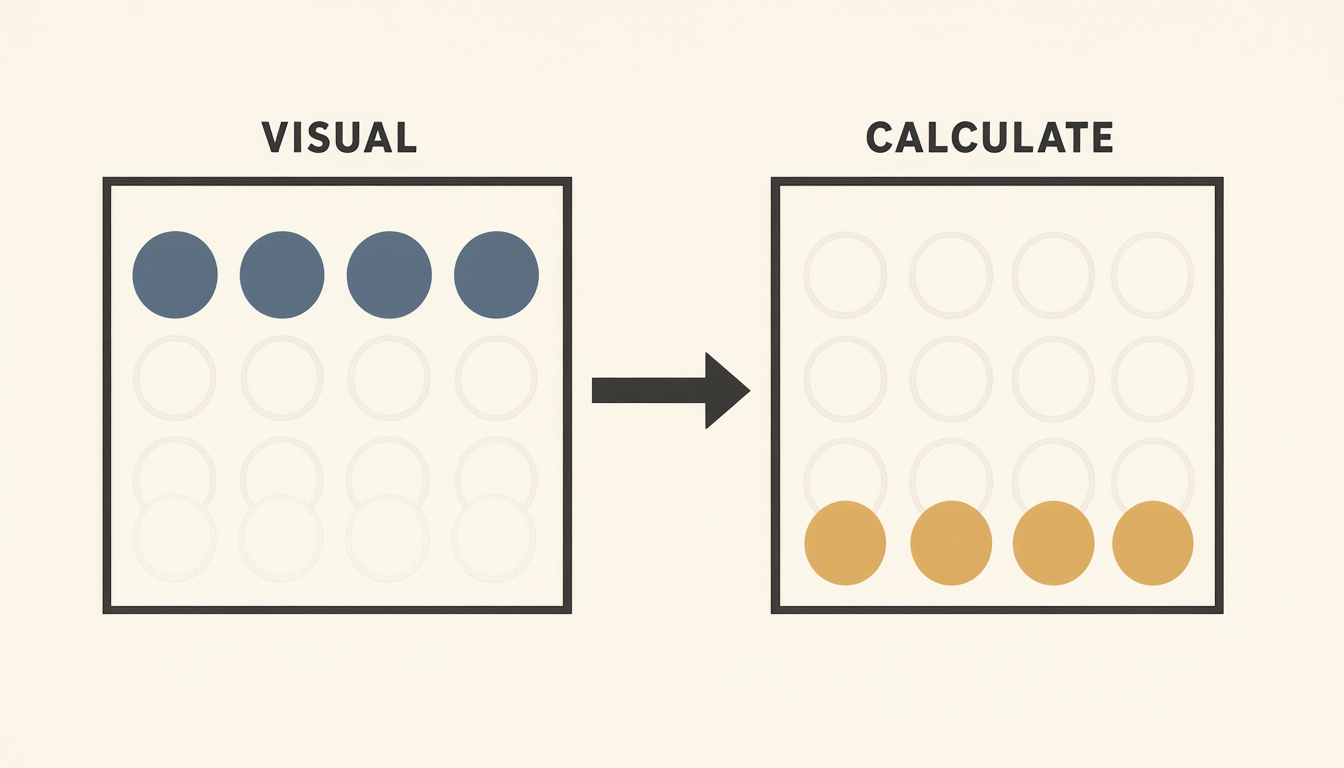
Note the ALL. The shorthand ignores whatever filter already exists on Timesheet[Billable] and puts its own filter in its place. Filters on other columns stay as they are.
Description
Two square charcoal frames on beige paper, joined by a thick arrow pointing from left to right. The left frame, labelled VISUAL, holds rows of faded coin outlines; only the top row of four slate-blue coins is solid — the selection the visual's filter lets through. The right frame, labelled CALCULATE, holds the same faded coins, but now only the bottom row of four ochre coins is solid. The idea: CALCULATE does not narrow the visual's selection further — it swaps the filter on that column for its own, so a different set of rows is counted. The picture does not show filters on other columns, which CALCULATE leaves in place.
4.1 When replacing is exactly what you want
Matrix with ClientName on rows:
| ClientName | Hours | Billable Hours |
|---|---|---|
| Contoso Energy | 12 | 10 |
| Fabrikam Logistics | 10 | 10 |
| Woodgrove Bank | 14 | 8 |
| Total | 36 | 28 |
The row filter is on ClientName, while CALCULATE filters Billable. These are different columns, so the two filters combine and the numbers are what Tomasz expected.
4.2 When it surprises you
Put Timesheet[Billable] on the rows instead:
| Billable | Hours | Billable Hours |
|---|---|---|
| N | 8 | 28 |
| Y | 28 | 28 |
| Total | 36 | 28 |
On the N row the cell's filter is Billable = "N". CALCULATE replaces it with Billable = "Y", so the cell shows 28. Exam trap: any question that puts on the axis the same column the measure filters is asking whether you know this.
The same thing happens with UK Hours = CALCULATE ( [Hours], Client[Country] = "UK" ):
| Axis on rows | Row | UK Hours | Why |
|---|---|---|---|
| ClientName | Contoso Energy | 12 | ClientName filter stays, Country = UK added: Contoso is UK |
| ClientName | Fabrikam Logistics | (blank) | ClientName = Fabrikam and Country = UK: no such rows |
| ClientName | Woodgrove Bank | 14 | both filters hold |
| Country | Ireland | 26 | Country = Ireland is replaced by Country = UK |
| Country | UK | 26 | replaced by the same value |
The Fabrikam row is blank and the Ireland row shows 26, even though Fabrikam is the Irish client. The difference is entirely about which column the visual filters.
4.3 Intersect instead of replace: KEEPFILTERS
If the requirement is "UK hours, but respect what the user has already selected", wrap the filter:
UK Hours (keep) = CALCULATE ( [Hours], KEEPFILTERS ( Client[Country] = "UK" ) )
KEEPFILTERS intersects the new filter with the existing one on the same column. With Country on rows: Ireland → blank, UK → 26.
A table filter also intersects, because it iterates only the rows that are already visible:
UK Hours (table) = CALCULATE ( [Hours], FILTER ( Client, Client[Country] = "UK" ) )
This works, but it is slower and less precise than KEEPFILTERS: it filters every column of Client, not just Country. Use FILTER when the condition needs something a simple predicate cannot express — most often a measure (section 6).
5. Removing filters: percent of total
Hours All Clients = CALCULATE ( [Hours], REMOVEFILTERS ( Client ) )
% of All Clients  = DIVIDE ( [Hours], [Hours All Clients] )
| ClientName | Hours | Hours All Clients | % of All Clients |
|---|---|---|---|
| Contoso Energy | 12 | 36 | 33.3 % |
| Fabrikam Logistics | 10 | 36 | 27.8 % |
| Woodgrove Bank | 14 | 36 | 38.9 % |
The functions that take filters away, and when to choose each one:
| Function (as a CALCULATE argument) | Removes | Keeps | Typical use |
|---|---|---|---|
REMOVEFILTERS ( Client ) |
filters on every column of Client | everything else | share of the whole firm |
ALL ( Client ) |
the same as REMOVEFILTERS when used as a modifier | everything else | older code; ALL can also return a table, REMOVEFILTERS cannot |
REMOVEFILTERS ( Client[ClientName] ) |
the filter on one column only | other Client columns, e.g. Country | share within the country |
ALLEXCEPT ( Client, Client[Country] ) |
all Client filters except Country | Country | the same, written the other way round |
ALLSELECTED ( Client ) |
filters the visual itself applies | filters from slicers and the outer report | "percent of what the user is looking at" |
Exam trap: "The percentage must still add up to 100 % when a user selects UK in a slicer" means ALLSELECTED. With REMOVEFILTERS the UK clients would add up to only 72 % (26 / 36), because the denominator would ignore the slicer.
6. Filtering by a measure
A Boolean filter argument may compare columns of one table with constants, but it cannot reference a measure. "Billable hours of clients with more than 10 hours in total" needs a table of clients to iterate:
Billable Hours Big Clients =
CALCULATE (
    [Billable Hours],
    FILTER ( VALUES ( Client[ClientName] ), [Hours] > 10 )
)
VALUES ( Client[ClientName] ) is a small table: one row per visible client. For each row FILTER evaluates [Hours], which is a measure and therefore triggers context transition (next section). Iterate the smallest table that answers the question — a dimension column, never the fact table.
7. The evaluation order of CALCULATE
Description
Five boxes stacked top to bottom and joined by arrows. One: the filter arguments are evaluated in the original filter context. Two: if there is a row context, context transition turns the current row into filters. Three: modifiers such as REMOVEFILTERS, ALL, USERELATIONSHIP and CROSSFILTER are applied. Four: the filter arguments are applied, replacing existing filters on the same columns, or intersecting with them when wrapped in KEEPFILTERS. Five: the expression is evaluated in the resulting filter context. The order explains why a filter argument wins over a filter that context transition created on the same column.
You rarely need the order on the exam. You need it when two of the steps touch the same column, for example a filter argument on a column that context transition has also filtered: step 4 comes after step 2, so the filter argument wins.
8. Context transition
Description
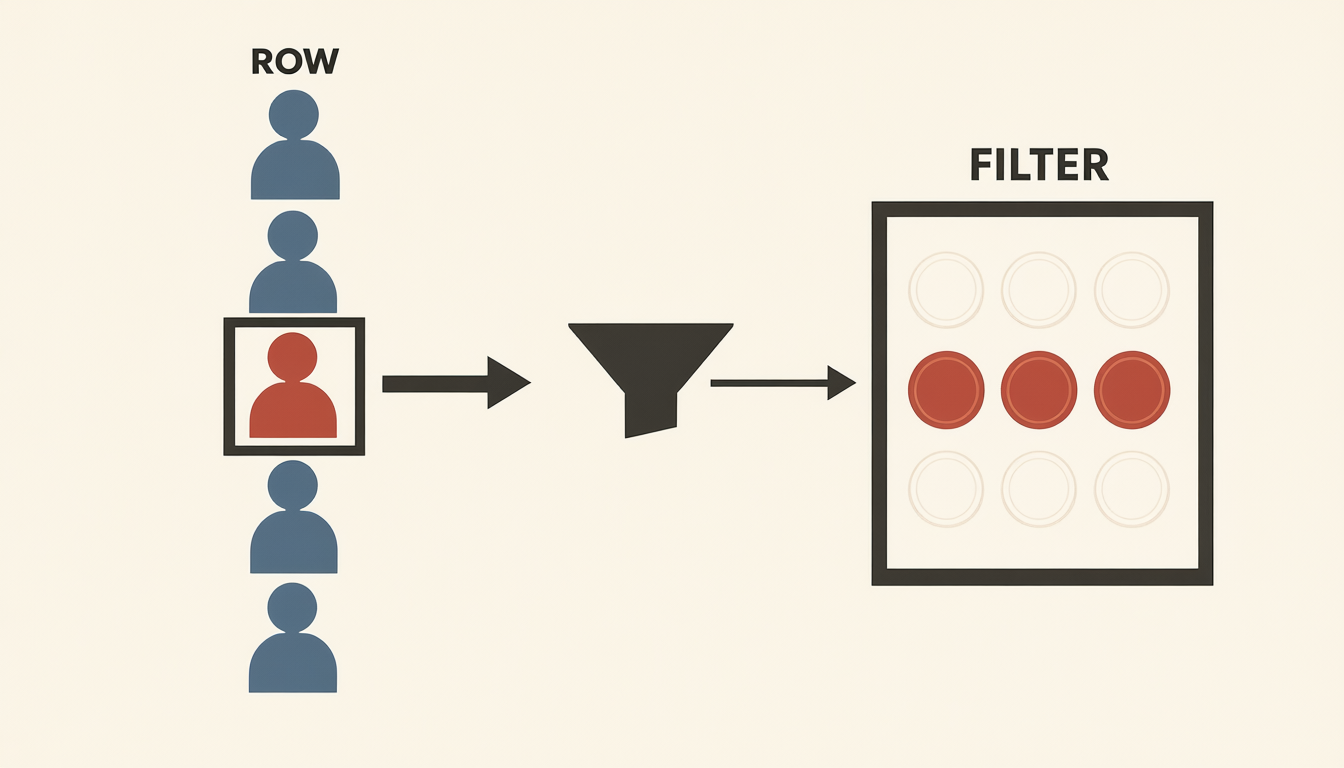
On the left, a column of five person pictograms stands for the rows of a table, labelled ROW; the middle person is brick red and framed. An arrow carries this one row into a black funnel. From the narrow end of the funnel an arrow enters a frame labelled FILTER, which holds nine coins in three rows: only the middle row of three brick-red coins is solid, the rest are faded. The idea: context transition turns the row being iterated into a filter, so the calculation sees only the fact rows that belong to that row. The picture does not show how many columns of the row become filters — in DAX, all of them do.
A row context exists in calculated columns and in iterators (SUMX, AVERAGEX, FILTER…). It means "I am on this row", but it does not filter anything. CALCULATE converts it: every column of the current row becomes a filter. That conversion is context transition.
Three calculated columns on Client:
| Calculated column | Contoso | Fabrikam | Woodgrove |
|---|---|---|---|
= SUM ( Timesheet[Hours] ) |
36 | 36 | 36 |
= CALCULATE ( SUM ( Timesheet[Hours] ) ) |
12 | 10 | 14 |
= [Hours] |
12 | 10 | 14 |
- The first column has no filter context, so SUM sees the whole Timesheet. This is the classic SQL-mind error: a developer expects a correlated subquery and gets a grand total.
- The second column uses CALCULATE with no filter arguments. Its only job here is context transition.
- The third references a measure. A measure reference always carries an implicit CALCULATE, so it triggers context transition too.
The same rule holds inside measures that iterate:
Avg Hours per Client (right) = AVERAGEX ( Client, [Hours] )                 -- total row: 12
Avg Hours per Client (wrong) = AVERAGEX ( Client, SUM ( Timesheet[Hours] ) ) -- total row: 36
In the wrong version each iteration sums all 36 hours (no transition), and the average of 36, 36 and 36 is 36.
Exam trap: "a calculated column returns the same value on every row" points to a missing context transition. The fix is CALCULATE or a measure reference.
9. The cost
- FILTER over a fact table is slow.
CALCULATE ( [Hours], FILTER ( Timesheet, Timesheet[Billable] = "Y" ) )iterates every visible timesheet row and can be orders of magnitude slower than the column predicate. On a 10-million-row fact table you will see it in Performance Analyzer (u14). - Context transition inside big iterators is expensive.
SUMX ( Timesheet, [Some Measure] )performs a transition for every fact row. Iterate a dimension orVALUESof a column instead. - Transition filters every column of the row. If a table has duplicate rows, the transition filters all identical rows at once. Iterating a table without a key gives silently wrong results.
- Readability. Every replaced filter is invisible on the report. A user who sees 28 on the "N" row will not guess why. Name such measures honestly (
Billable Hours (ignores Billable filter)), or useKEEPFILTERSif the visual's filter should win.
| SQL intuition | What DAX actually does |
|---|---|
WHERE Billable = 'Y' adds a condition |
a CALCULATE filter replaces the filter on that column |
SUM(Hours) OVER () for a grand total |
CALCULATE ( [Hours], REMOVEFILTERS ( … ) ) |
| a correlated subquery per row | a calculated column needs context transition to see "its" rows |
HAVING SUM(Hours) > 10 |
FILTER ( VALUES ( … ), [Hours] > 10 ) inside CALCULATE |
10. Lab — CALCULATE on the Aldervane dataset
You need: Power BI Desktop (free, Windows) and the public dataset aldervane-pbi-dataset (CSV files plus a README with the relationships). Time: about 40 minutes. Cost: none.
- Get data → Text/CSV for
DimClient,DimEngagementandFactTimesheet. In Model view createDimClient[ClientKey] 1 → * DimEngagement[ClientKey]andDimEngagement[EngagementKey] 1 → * FactTimesheet[EngagementKey], both single direction. - Create the measures:
Hours = SUM ( FactTimesheet[Hours] ) Billable Hours = CALCULATE ( [Hours], FactTimesheet[Billable] = "Y" ) UK Hours = CALCULATE ( [Hours], DimClient[Country] = "UK" ) UK Hours (keep) = CALCULATE ( [Hours], KEEPFILTERS ( DimClient[Country] = "UK" ) ) Hours All Clients = CALCULATE ( [Hours], REMOVEFILTERS ( DimClient ) ) % of All Clients = DIVIDE ( [Hours], [Hours All Clients] ) - Open DAX query view and run:
Expected: Ireland 9 664 / 18 907 / blank; Poland 6 186 / 18 907 / blank; UK 18 907 / 18 907 / 18 907. Explain each number aloud before you look.EVALUATE SUMMARIZECOLUMNS ( DimClient[Country], "Hours", [Hours], "UK Hours", [UK Hours], "UK Hours (keep)", [UK Hours (keep)] ) - Build a matrix with
DimClient[ClientName]on rows and[Hours],[% of All Clients]. Contoso Energy should show 19.5 %. Add a slicer onCountry, select UK, and watch the percentages stop adding up to 100 %. Change the denominator toALLSELECTED ( DimClient )and check again. - On
DimEngagementadd two calculated columns:Hours (bare) = SUM ( FactTimesheet[Hours] )andHours (CT) = [Hours]. For ENG-4401 expect 34 757 and 1 567.5. - The overall total is 34 757 hours as loaded: this lab loads the CSVs fresh, so the deliberate −3-hour entry is still in. The u04 clean-up removes it (34 760 hours after it); the lab numbers above are as loaded.
No Windows machine, or Desktop blocked? Work through steps 2–5 on paper using the expected numbers above. Every practice item in this unit can be solved without Power BI.
11. Exam traps — summary
- A filter argument replaces the filter on the same column; other columns keep their filters.
- Same column on the axis and in the filter argument → every row shows the same number.
- "Respect the user's selection" →
KEEPFILTERS(or a table filter). - "Percent of everything" →
REMOVEFILTERS/ALL; "percent of what is selected" →ALLSELECTED; "percent within the country" → remove the ClientName filter only /ALLEXCEPT. - A Boolean filter cannot use a measure →
FILTER ( VALUES ( … ), [Measure] > x ). - Calculated column shows the grand total on every row → missing context transition; use CALCULATE or a measure reference.
- A measure reference = an implicit CALCULATE.
12. Remember the pictures
Retell each picture in one sentence. The two frames: CALCULATE swaps the filter on a column, it does not narrow it. The funnel: the current row becomes a filter. If you can say both without looking, you hold the core of this objective.
Sources: Microsoft Learn — "CALCULATE function (DAX)", "KEEPFILTERS function (DAX)", "ALLSELECTED function (DAX)", "Modify DAX filter context in semantic models" (training module, unit "Perform context transition"), "DAX query view". Exam PL-300 study guide, skills measured as of April 20, 2026.