
Exam objective (all four domains): Prepare the data (25–30 %), Model the data (25–30 %), Visualize and analyze the data (25–30 %), Manage and secure Power BI (15–20 %). This unit maps them, sets up your lab and fixes the vocabulary every later unit uses. Related: Choose between DirectLake, DirectQuery, and Import (u03), Create and configure a workspace and Choose a distribution method (u21), Identify when a gateway is required (u22).
1. The pain: "it's just charts on top of SQL"
Aldervane Advisory LLP runs its engagements and billing on ENGAGE, a SQL Server application. Reporting today is a folder of Excel workbooks that Priya, a developer, refreshes by hand every month-end. The Head of Consulting has asked Tomasz, a senior developer with ten years of T-SQL, to move it to Power BI and to get the PL-300 certification while he does it.
Tomasz's first plan: "Power BI is a chart tool. I'll write views, point Power BI at them and drag fields onto a canvas." Within a week he hits four walls:
- He builds a report in Power BI Desktop, emails the
.pbixfile to the Head of Consulting, and she cannot open it on her Mac. - He publishes to My workspace and shares the report. His colleagues without a Pro licence see an error instead of the report.
- He hears that "the dataset is now a semantic model" and that the firm is "moving to Fabric", and is not sure whether these are three products or one.
- He opens the PL-300 study guide and finds Direct Lake, Copilot, calculation groups, visual calculations, RLS and sensitivity labels side by side.
None of this is SQL. This unit gives you the map: which tool does what, what each licence allows, what the exam looks like, and the lab you will use for the next 27 units.
2. The exam in numbers
| Item | Value (check the exam page before you book) |
|---|---|
| Exam | PL-300, Microsoft Power BI Data Analyst → certification Power BI Data Analyst Associate |
| Time | 100 minutes of exam time; plan about 120 minutes of seat time for instructions and the agreement |
| Questions | Microsoft says most exams have 40–60 questions; the count varies |
| Pass mark | 700 on a scaled score |
| Labs | none; PL-300 is an associate exam without labs |
| Renewal | every 12 months, by a free online assessment on Microsoft Learn |
| Skills outline | skills measured as of April 20, 2026 (study guide) |
Domains and what they mean for a developer:
| Domain | Weight | Where your SQL instinct helps | Where it misleads you |
|---|---|---|---|
| Prepare the data | 25–30 % | sources, types, joins, keys | Power Query is not SQL: steps, privacy levels, query folding |
| Model the data | 25–30 % | star schema, cardinality | DAX filter context is not WHERE; relationships are not joins |
| Visualize and analyze | 25–30 % | little | report design, interactions, Copilot, visual calculations |
| Manage and secure | 15–20 % | roles, least privilege | workspace roles vs item permissions vs RLS vs labels |
Question formats you will meet: single and multiple choice; drag-and-drop ordering of steps ("arrange the Power Query actions in sequence"); hot area and Yes/No series ("Does this solution meet the goal?"); drop-down lists that complete a DAX or M expression; and case studies — a long scenario about one company followed by several questions. The course practice uses the same shapes.
Microsoft Learn during the exam. For associate and expert exams you can open Microsoft Learn in a split screen during the exam. No extra time is added and the timer keeps running. Treat it as a way to confirm one detail, not as a way to learn a topic. u24 shows how to search quickly.
Exam trap: the outline changes several times a year. Questions test the current product: "semantic model", not "dataset"; Direct Lake, Copilot and visual calculations are all in the current outline (skills measured as of April 20, 2026). If a training source still says "dataset" everywhere, check what else it has missed.
3. The landscape: Desktop, Service, Fabric
Description
A left-to-right flow. On the far left, a box of sources such as SQL Server, CSV, Excel, SharePoint and a lakehouse. Next, a frame labelled Power BI Desktop, Windows, free, containing three boxes in a row: Power Query, which shapes the data; the semantic model with tables, relationships and DAX; and the report, made of pages of visuals. An arrow labelled publish leads from the report into a second frame, the Power BI service in Microsoft Fabric at app.powerbi.com. Inside it, a workspace holds the semantic model and report; from the workspace one arrow labelled pin leads to a dashboard of pinned tiles and another labelled publish app leads to an app packaged for an audience. Both lead to consumers in a browser, Teams or the mobile app. Desktop is where you build; the service is where you share, refresh and secure.
| Term | What it is | SQL-world analogy | Where it lives |
|---|---|---|---|
| Power BI Desktop | free Windows authoring tool: Power Query + model + report in one .pbix file |
SSMS + SSDT + SSRS designer in one | your PC |
| Power Query | the data-shaping engine; each query is a list of steps written in the M language | an ETL package, not a view | inside Desktop (and dataflows) |
| Semantic model | tables, relationships, measures and security that reports query; formerly called dataset | a small analytical database (it is an Analysis Services tabular model) | Desktop file, then a workspace |
| Report | one or more pages of interactive visuals bound to one semantic model | an SSRS report, but interactive | Desktop and service |
| Dashboard | a single canvas of tiles pinned from one or more reports; service only | a portal home page | service |
| Workspace | a container for items, with roles (Admin, Member, Contributor, Viewer) | a database schema with permissions | service |
| App | a read-only package of a workspace's content for a wider audience | a published release | service |
| Paginated report | pixel-perfect, printable report (.rdl) |
literally SSRS | service (built in Power BI Report Builder) |
| Microsoft Fabric | the SaaS platform the Power BI service now runs in: OneLake, lakehouses, warehouses, pipelines, notebooks — and Power BI | the whole data estate, not just reporting | service |
Confusion pairs that the exam loves:
- Report vs dashboard. A report has pages, filters, slicers and drillthrough and is built in Desktop or the service. A dashboard is one page of pinned tiles, exists only in the service, and can combine tiles from several reports.
- Semantic model vs report. One semantic model can feed many reports. Delete the model and every report on it breaks. "Build permission" (u23) is a permission on the model.
- Workspace vs app. People who build work in the workspace. People who only read should get the app (u21).
Description
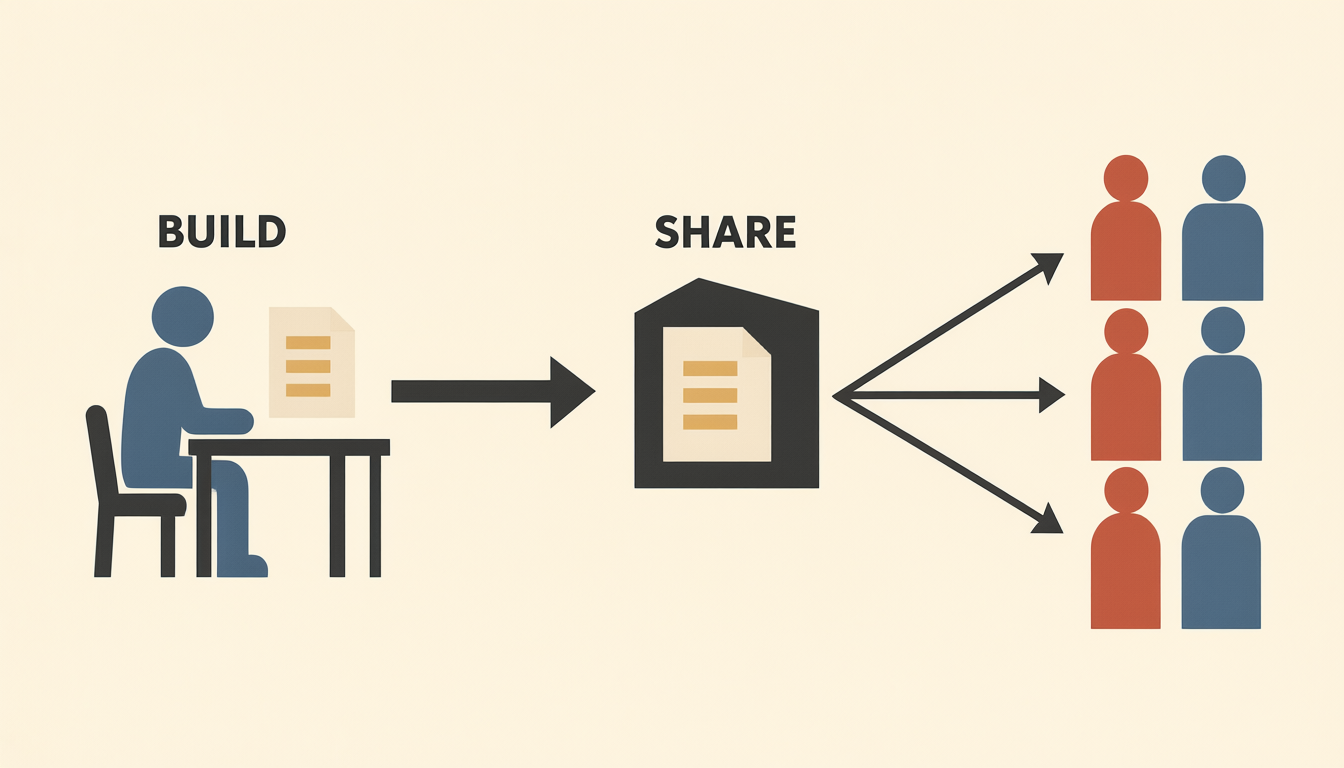
Beige background, two scenes side by side joined by a thick charcoal arrow from left to right. Left scene, labelled BUILD: one slate-blue person pictogram seated on a chair at a simple charcoal desk, beside a single document sheet showing three short ochre bars. Right scene, labelled SHARE: a simple charcoal building with the same document sheet on its front, and from it three thin arrows fan out to six standing person pictograms in three rows of two, three in brick red and three in slate blue. The idea: Desktop is where one author builds, the service is where the work is shared with many readers. The picture does not show licences, refresh or security, and does not show any real chart values.
Exam trap: "a user needs to combine visuals from three reports on one page" → dashboard. "A user needs to slice, filter and drill through" → report. Dashboards are not built in Desktop.
4. Licences: who can do what
| Licence | What it allows | Typical Aldervane user |
|---|---|---|
| Fabric (Free) | Desktop (no licence needed at all) and My workspace for personal use; cannot share or publish to other workspaces. Can view content only when it sits in a workspace on Power BI Premium (P) or Fabric F64 or larger capacity | a partner who only reads reports — if the firm has F64+ |
| Power BI Pro | publish to workspaces, share, collaborate with other Pro users; models up to 1 GB in shared capacity; scheduled refresh up to 8 times a day | Tomasz and Priya |
| Premium Per User (PPU) | everything in Pro plus most Premium capacity features, for that user only; content in a PPU workspace can be shared only with other PPU users (unless it sits in Premium capacity) | a small analytics team |
| Fabric capacity (F SKU) / Premium capacity (P SKU) | capacity bought for the organisation: larger models, refresh up to 48 times a day, Direct Lake (Fabric capacity), Copilot (paid F2+ or P1+); F64+ also lets free users read | the firm |
Two capacity facts that come up again and again:
- Fabric trial. A Fabric trial capacity lasts 60 days and gives you Fabric workloads plus Power BI with Pro/PPU-level features for the trial user. Copilot is not supported on trial capacities — Copilot in Power BI needs a paid Fabric capacity (F2 or larger) or Power BI Premium (P1 or larger), plus tenant settings. u17 has a read path for this reason.
- Direct Lake needs Fabric capacity. Import and DirectQuery work with any licence; Direct Lake models live on Fabric capacity (u03).
Exam trap: "Users with free licences must view the report" has two right answers depending on the scenario: put the workspace on F64+ / Premium capacity, or give each viewer Pro. Sharing from a Pro workspace to free users without capacity does not work.
5. The course map and the running case
| Units | Domain | What you will be able to do |
|---|---|---|
| u02–u06 | Prepare the data | connect, choose a storage mode, profile, clean and shape with Power Query |
| u07–u14 | Model the data | star schema, relationships, date table, DAX (CALCULATE, time intelligence), calculation groups, performance |
| u15–u20 | Visualize and analyze | visuals, visual calculations, Copilot, storytelling, usability, analytics |
| u21–u23 | Manage and secure | workspaces, apps, gateways, refresh, roles, RLS, labels |
| u24 | Rehearsal | a full case study under time pressure |
| u25–u28 | Optional | PBIP/TMDL/Git, SQL→DAX phrasebook, client confidentiality, Fabric bridge |
The Aldervane dataset (public GitHub repository aldervane-pbi-dataset) is a synthetic export of ENGAGE:
| File | Rows | What it is |
|---|---|---|
DimDate.csv |
730 | every day of 2025 and 2026; fiscal year July–June (FY26 = 1 Jul 2025 – 30 Jun 2026) |
DimEmployee.csv |
36 | grade, office, cost rate, standard bill rate, email |
DimClient.csv |
12 | industry, country (UK, Ireland, Poland), audit-client flag |
DimEngagement.csv |
30 | client, service line, engagement partner, budget, status |
FactTimesheet.csv |
10 258 | one row per time entry, up to 30 Sep 2026 |
FactInvoice.csv |
236 | invoices with three dates: invoice, due, paid |
FactWIPSnapshot.csv |
320 | month-end work-in-progress balance per engagement |
engagement_teams.json |
30 engagements | nested JSON export for Power Query practice |
The data has a few deliberate defects that you will find and fix in u04. Until then, numbers in this course are labelled "as loaded"; after u04 they are labelled "after the u04 clean-up". Total hours as loaded: 34 757.
6. The confidentiality rule
Aldervane is a professional-services firm, and so is the firm you probably work for. The rule for this course is absolute: never put client data into a lab, a personal tenant, a trial, a public repository or a Copilot prompt. Use the synthetic Aldervane data only. Every client name in it is one of Microsoft's fictitious sample companies (Contoso, Fabrikam, Northwind…), and every person and number is invented.
This is not only good manners. A .pbix file is a copy of the data (in Import mode), not a link to it. Emailing one is emailing a database extract.
7. The cost
- Licences. Every author and every sharer needs Pro or PPU; readers need Pro too unless the content sits on F64+ (or Premium) capacity. Capacity is billed whether or not anyone uses it (pausable F SKUs in Azure are the exception).
- Windows. Desktop is Windows-only (Windows 10 / Server 2016 or later, 64-bit). Mac users need a Windows VM or must author in the service, which can do less.
- Monthly releases. Desktop and the service change every month; only the latest Desktop version is supported. Screenshots in any course, this one included, age quickly.
- Corporate tenants. Big 4 tenants often block publishing, trials, gateways and Copilot. Plan to practise service features in a personal sandbox (below), never with client data.
- Your time. About 40–45 hours for the mandatory units of this course, plus practice assessments.
8. Lab — set up your environment
You need: a Windows PC (or Windows VM), an internet connection, optionally an Azure free account. Time: about 45 minutes. Cost: none.
- Install Power BI Desktop from the Microsoft Store (recommended: automatic updates, no admin rights needed) or from the Microsoft Download Center (64-bit
.exe). You do not need to sign in to use it. - Download the dataset. From the public GitHub repository aldervane-pbi-dataset, download the repository as a ZIP and unpack it to a short path, for example
C:\Data\aldervane-pbi-dataset\. Thedatafolder must contain seven CSV files and one JSON file. - Read the repository's
README.md: the relationships to build, the fiscal year and the list of deliberate defects. - First load. In Desktop: Home → Get data → Text/CSV →
FactTimesheet.csv→ Load. Open Table view (the grid icon on the left rail); the status bar shows the row count. Expected: 10 258 rows. - In Report view add a Card visual and drag
Hoursonto it. Expected: 34 757 (as loaded — one deliberate negative entry is still inside; u04 removes it). - Save the file as
aldervane-u01.pbix. Note its size on disk: this is the compressed copy of the data that Import mode creates. - Optional — a free service sandbox. Power BI service sign-up needs a work or school account; Gmail or Outlook.com addresses are refused. One free route at the time of writing: create an Azure free account → it comes with a Microsoft Entra tenant (
*.onmicrosoft.com) → in Microsoft Entra ID → Users create a user such aslab@yourtenant.onmicrosoft.com→ sign in as that user at app.powerbi.com → start a Fabric trial (60 days) → create a workspaceAldervane Lab. Do not store anything but the synthetic dataset there.
Expected results: Desktop opens; FactTimesheet has 10 258 rows and 34 757 hours as loaded; optionally you can sign in to the service with a work-format account and see a workspace on trial capacity.
This screenshot has not been added yet — its description is below.
A full Power BI Desktop window. On the left rail, the view icons are visible from top to bottom — Report, Table, Model, DAX query and TMDL view — with Table view selected. The main area shows the FactTimesheet table as a grid with the columns TimesheetID, DateKey, EmployeeKey, EngagementKey, Hours, Billable, StandardValue and CostValue. The Data pane on the right lists FactTimesheet. The status bar at the bottom shows the table name and the row count 10,258. The ribbon shows the Home tab with Get data and Transform data.
No Windows machine / service blocked? Read the dataset files in any text editor or spreadsheet: count the rows of each CSV (minus the header) against the table in section 5, and open engagement_teams.json to see its nesting. For the service, study the screenshots in u21–u23; every practice item in this course can be solved without running Power BI.
9. Exam traps — summary
- Desktop builds (Power Query, model, report); the service shares, refreshes and secures. Dashboards exist only in the service.
- "Dataset" is now semantic model. A report is bound to exactly one semantic model; a dashboard can show tiles from many reports.
- Free users can view shared content only on Premium P or Fabric F64+ capacity; otherwise they need Pro.
- PPU content can be shared only with PPU users unless it sits in Premium capacity.
- Copilot needs paid F2+ or P1+; not a trial capacity. Direct Lake needs Fabric capacity.
- Fabric trial = 60 days.
- During the exam Microsoft Learn is available, but the clock does not stop.
10. Remember the pictures
The desk and the building: one author builds in Desktop, the service shares with many. If you can also redraw the landscape scheme from memory — sources, Power Query, model, report, publish, workspace, dashboard, app — you have the map for the rest of the course.
Sources: Microsoft Learn — "Exam PL-300: Microsoft Power BI Data Analyst" (study guide), "Microsoft Certified: Power BI Data Analyst Associate", "Exam duration and exam experience", "Power BI service features by license type", "Try Microsoft Fabric for free", "Enable Fabric Copilot for Power BI", "Direct Lake overview", "Download Power BI Desktop", "Sign up for or purchase Power BI as an individual". Exam PL-300 study guide, skills measured as of April 20, 2026.